【文献精读】Characterizing-Microservice-Dependency-and-Performance-阿里巴巴微服务trace分析
Apr 5, 2023 - #Research
Metadata
- Authors: Shutian Luo, Huanle Xu, Chengzhi Lu, Kejiang Ye, Guoyao Xu, Liping Zhang, Yu Ding, Jian He, Chengzhong Xu
- Series: SoCC '21
- Cite Key: @[[luoCharacterizingMicroserviceDependency2021]]
- Link: Characterizing_Microservice_Dependency_and_Performance_Proceedings_of_the_ACM_Symposium_on_Cloud_Computing_2021.pdf
- Bibliography: Luo, S., Xu, H., Lu, C., Ye, K., Xu, G., Zhang, L., Ding, Y., He, J., & Xu, C. (2021). Characterizing Microservice Dependency and Performance: Alibaba Trace Analysis. Proceedings of the ACM Symposium on Cloud Computing, 412–426. https://doi.org/10.1145/3472883.3487003
Abstract
Loosely-coupled and light-weight microservices running in containers are replacing monolithic applications gradually. Understanding the characteristics of microservices is critical to make good use of microservice architectures. However, there is no comprehensive study about microservice and its related systems in production environments so far. In this paper, we present a solid analysis of large-scale deployments of microservices at Alibaba clusters. Our study focuses on the characterization of microservice dependency as well as its runtime performance. We conduct an in-depth anatomy of microservice call graphs to quantify the difference between them and traditional DAGs of data-parallel jobs. In particular, we observe that microservice call graphs are heavy-tail distributed and their topology is similar to a tree and moreover, many microservices are hot-spots. We reveal three types of meaningful call dependency that can be utilized to optimize microservice designs. Our investigation on microservice runtime performance indicates most microservices are much more sensitive to CPU interference than memory interference. To synthesize more representative microservice traces, we build a mathematical model to simulate call graphs. Experimental results demonstrate our model can well preserve those graph properties observed from Alibaba traces.## Annotations
%% begin annotations %%
Main Content
2. 微服务架构
2.1 调用图
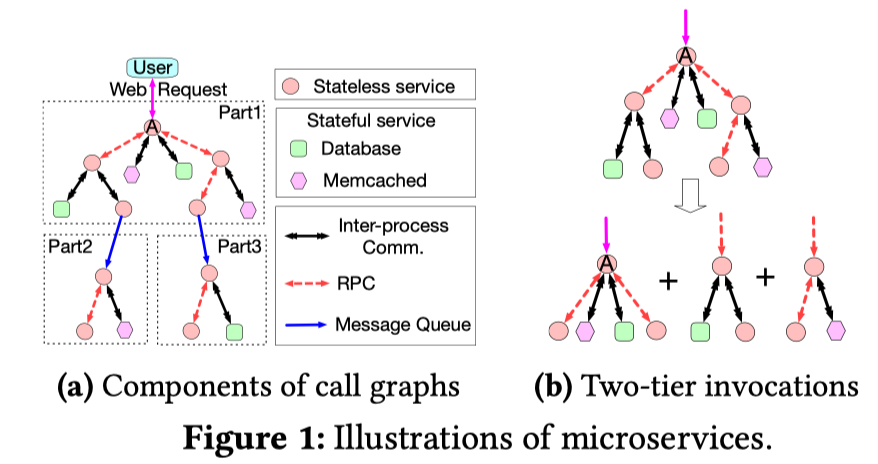
微服务可以被分成两类:
- Stateful:例如Memcached和databases,通常提供读写数据的接口
- Stateless:提供不同目的的各种接口 微服务之间会有三种类型的通信方式:
- 远程调用(RPCs):无向边,发送RPC请求的服务通常需要等待回应(同步方式)
- 消息队列(MQ):有向边,发送方会将消息发送给一个第三方做持久化,接收方则会从第三方获取消息,并且不会返回Response(异步方式)
- 进程间通信(IP):经常发生在同一个节点的stateless和stateful的服务之间
通过MQ通常可以将微服务图划分为若干个部分,每个部分又可以划分为若干个两层调用(two-tier invocations),调用方称为(Upstream Microservice, UM),被调用方(Downstream Microservice,DM)
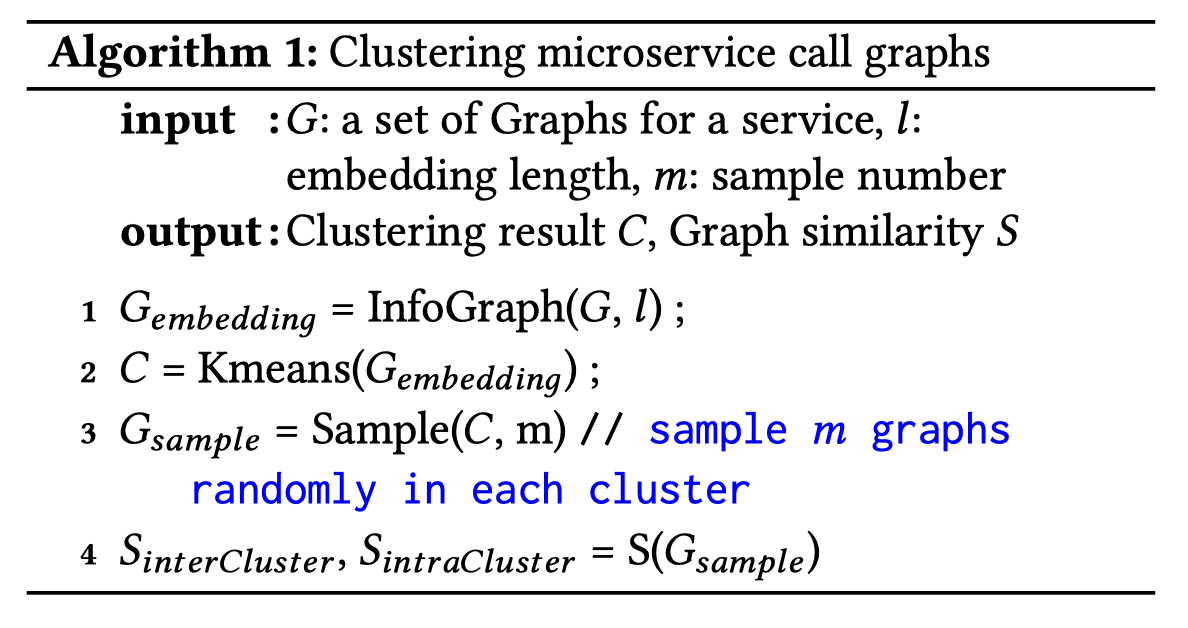
2.2 图学习算法(图聚类)
[[InfoGraph]]是一种非监督学习的方法,将节点信息(微服务类型)以及边特征(通信框架)作为深度神经网络的输入训练,以最大化训练集中的互信息,以此可以为每一个图生成一个embedded向量。再利用生成的向量利用K-means算法完成聚类,使用Silhouette score度量k值的优劣。
3. 调用图剖析
3.1 微服务调用图的大小遵循重尾分布(如Burr Distribution)
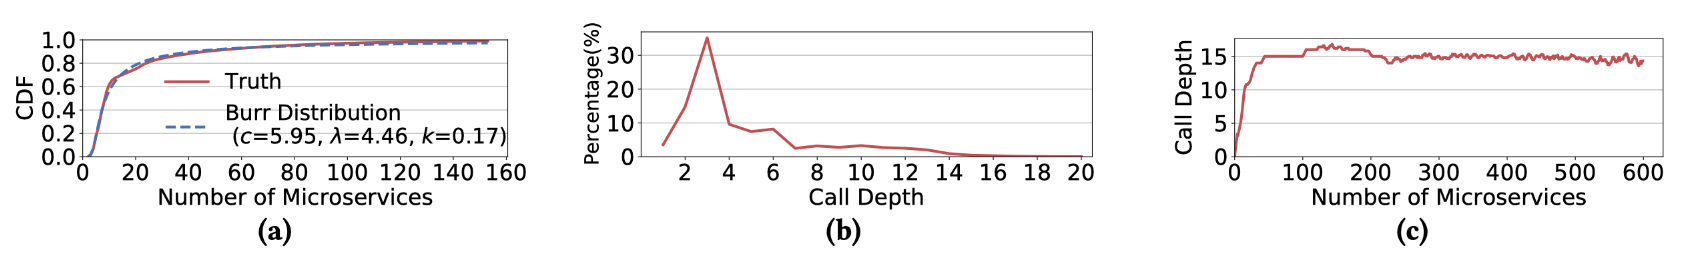
- 大多数调用图仅仅包含少量的微服务,但同时,也有不可忽视的一部分调用图很大很深
- 有超过10%的调用图包含超过40种不同的微服务,在这些large size的调用图中,有50%的微服务是Memcacheds
- 常见的调用深度是3,因为往往调用过程中会直接去Memcacheds中取数据,所以通常的调用图都很短 (比传统的batch applications要短)
- 但同时,也有4%的调用图的调用深度会超过10,但是当微服务数量再上升的时候,微服务的深度却不会再加深了(c图)
3.1 微服务调用图的结构更类似一个树,并且其中很多都有一个较长的调用链
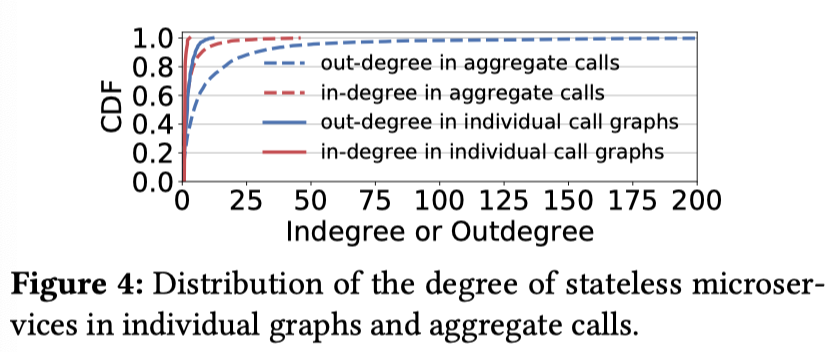
- 大多数微服务仅仅只有一个出度(只有一个UM)
- 有99%的微服务的出度不超过3,入度符合一个重尾分布
- 大量的层(tire)只有一个服务,因此,很多比较深的调用图可以被表示为一个长链,对于这些图来说,找到微服务中的瓶颈是相对来说比较容易的
- 有很多的stateless的服务是热点,聚合调用(agregate calls)统计显示有超过5%的服务出现在了90%的调用图中并且处理了95%的任务
3.2 微服务调用图是高度动态的
每当一个用户请求到达Entering Microservice,接下来的调用路径会变得非常复杂,因为这还要取决于用户的状态(例如在为用户排序商品的时候,用户是否有优惠卷会影响排序的调用路径),这更加强调了微服务中需要基于图的预测任务。
3.3 剖析
Stateless 微服务的调用特征可以分为3种类型(Fig 8-a):
- blackhole:调用图终止于此,不会再产生新的分叉
- relays:一定会调用其他服务用于响应用户请求
- normal:以一定概率调用DMs的服务 微服务中每一层这三种类型节点的分布都不一样,每一层normal服务的调用概率分布也不一样
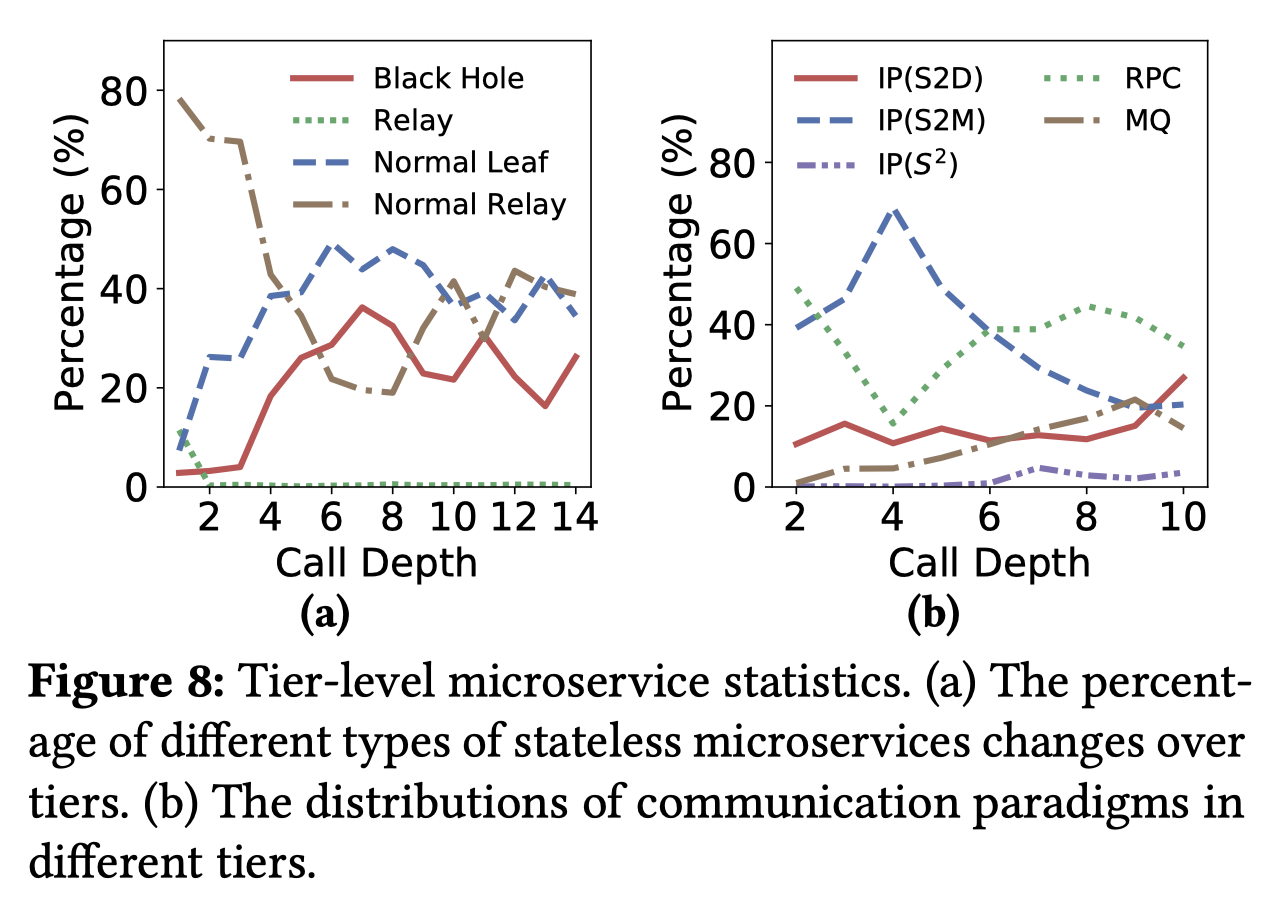
随着调用图越来越深,Stateless访问Memcacheds的IP会线性的下降,因为调用图深的请求往往是发生了 Memcacheds 的cache miss,因此会去Database里面获取数据,IP(S2D)呈上升趋势,而S2D的上升和S2M下降的差距会由MQ来填补上。
4. Stateless微服务间的依赖分析
4. 1 循环依赖
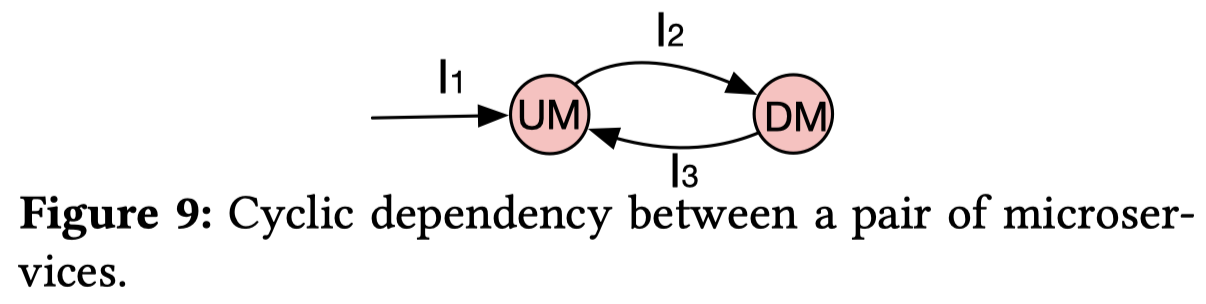
- 微服务的所有依赖中,循环依赖占到了超过7.8%
- 循环依赖可以分为两种类型:
- strong dependency:到达UM的调用和DM回复调用接口是相同的(\(I_1=I_3\) in Fig 9),并且存在strong dependency 循环调用的两个微服务间发生循环调用的概率高达83%。这种情况下,如果设计不当很可能会造成微服务间的死锁
- weak depency:\(I_1 \ne I_3\) in Fig 9
- 很少存在多个微服务参与的循环调用(long cyclic calls),因此通常只用考虑两层的cyclic denpendency及其优化(可以考虑将存在cyclic dependency的两个微服务合并)
4.2 耦合依赖——具有很高调用概率和很多调用次数的依赖
为一个两层调用\(Y->X\)定义两个metric:
\[ \begin{aligned} Call Probability(Y2X) = Count(X) / Sum \\ Call Time(Y2X) = Count(X) / N \end{aligned} \]
其中\(Count(X)\)表示UM Y调用DM X的次数(注意在一次请求中一个DM可能会被Y调用多次),\(Sum\)表示Y在所有调用图中发起的两层调用的个数和,\(N\)表示\(Sum\)
中DM X被调用的那些两层调用的个数。
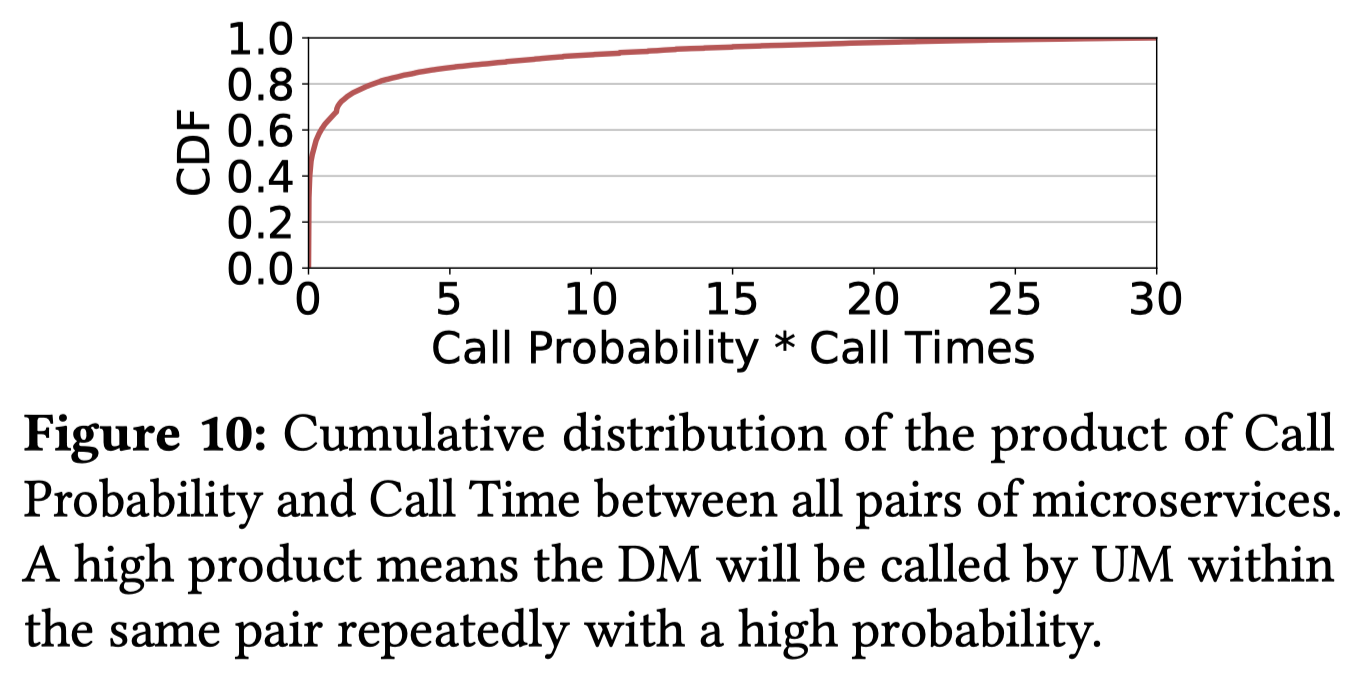
从Fig 10中可以看出来,有超过10%的微服务对的Call Time和Call Probability的乘积大于5,这说明有相当一部分微服务对有着很强的耦合依赖。
同时还发现,有强耦合依赖的微服务对中有17%不会与其他微服务分享DM(入度为1),这意味着可以将这对服务本地化,以减少远程调用产生的开销
5 微服务运行时性能
5.1 微服务调用率
- 微服务调用率(Microservice call rate, MCR,每分钟微服务收到的调用数)和CPU利用率以及Young GC高度相关,但是和内存利用率不高度相关,这说明CPU利用率和Young GCs能够更好的反应运行微服务容器的资源压力
- 相对来说,内存使用情况在大多数容器中都是非常稳定的,与先前的研究结果相符
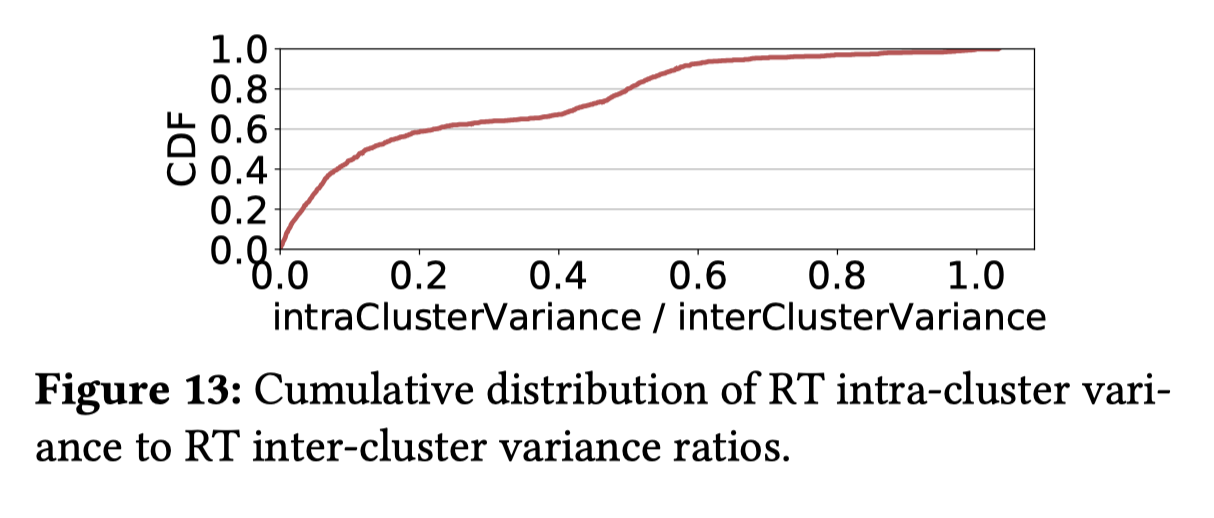
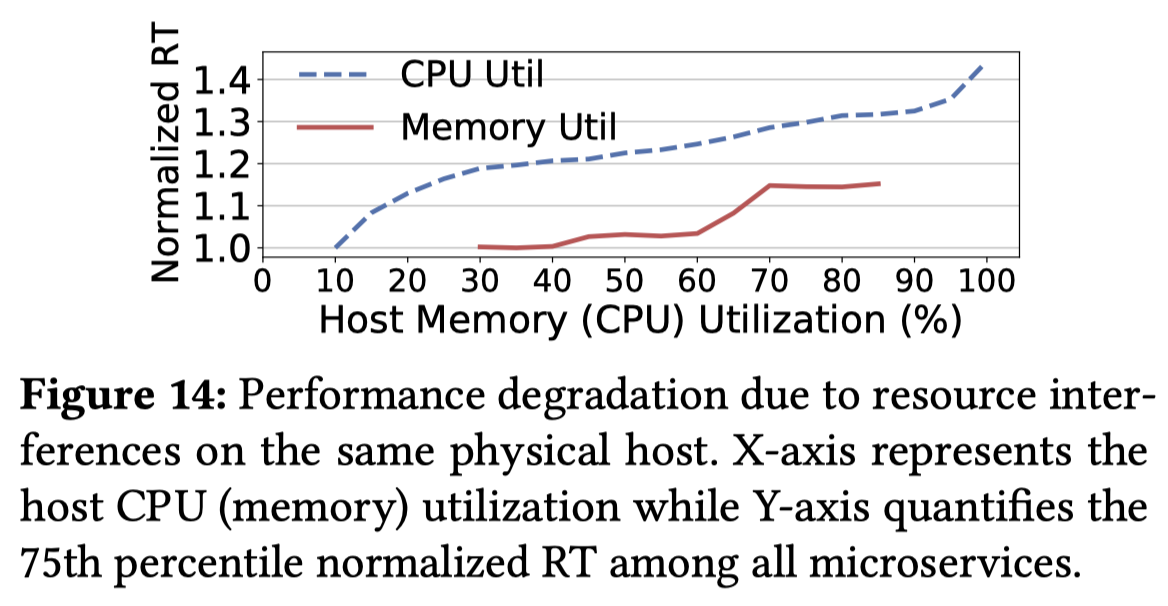
5.2 微服务时延性能(RT)
- 一个在线服务的端到端时延(RT, entering
调用的返回时间)在具有类似拓扑结构的调用图中很相似,但是具有不同拓扑结构的调用图之间有很大差异,这也说明了图学习算法可以用来预测延时
- 时延性能可能会随着CPU利用率的增加而严重退化
- 按照建模的观点来看,RT应该是MCR和分配资源的一个函数,所以当分配资源和调用图拓扑一定时,RT应该只与MCR有关,但是Alibaba Trace中的RT却不怎么随MCR的增加而变化,这是因为Alibaba Cluster中的大多数调用都会被立即处理而不会产生排队时延,并且大多数容器中CPU的利用率都小于10%,这也进一步说明了在微服务资源利用率的优化方面还有很大的空间。
6. 微服务图的概率模型生成
文章还提出了一个概率模型去生成微服务图以及调用trace,可以更好的模拟生产级别的微服务架构和用户请求。